Did you know that even world-class manufacturing plants usually reach only 80% to 90% of their total capacity? Total effective equipment performance gives a complete picture of your production potential that many manufacturers miss.
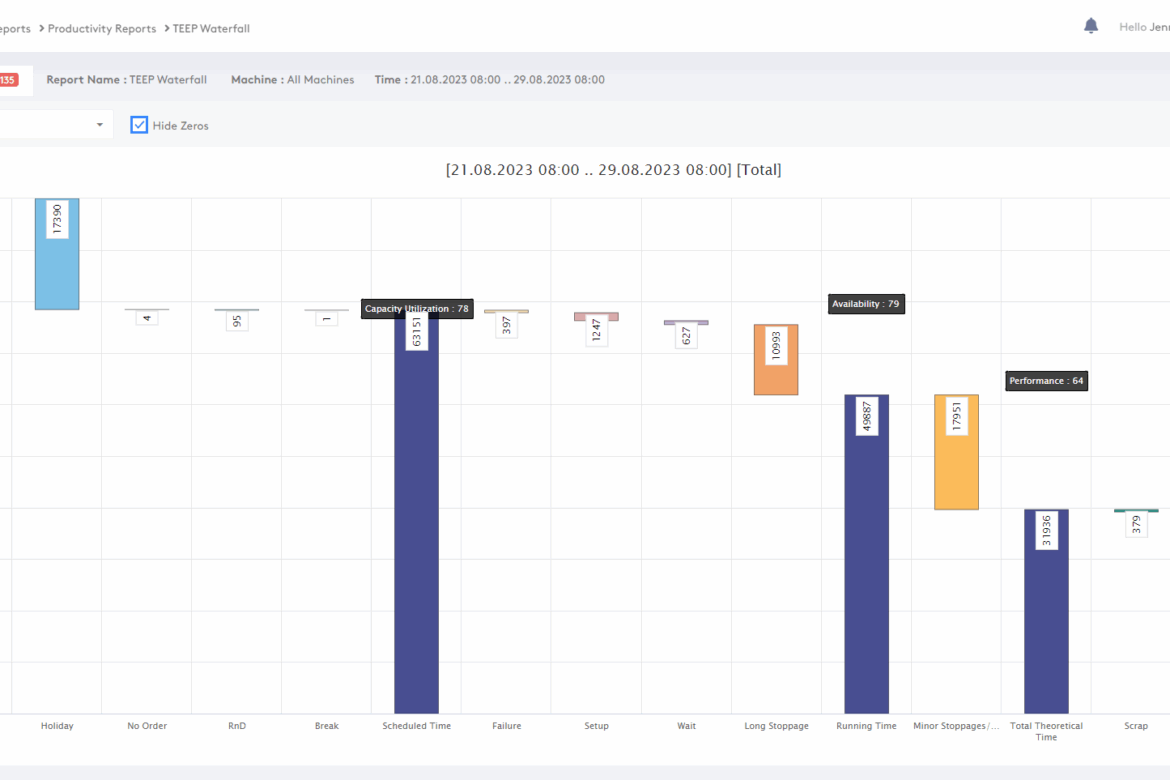
Overall equipment effectiveness (OEE) measures performance during scheduled production time. Total effective equipment performance (TEEP) looks at your equipment performance during all available time—including periods when machines aren’t running. This difference is vital to get a complete equipment performance analysis. The TEEP formula is straightforward: TEEP (%) = OEE (%) × Utilisation (%). Manufacturing leaders who want to maximise their capacity can discover hidden production potential by understanding these total effective equipment performance KPIs.
Let’s explore the main differences between these metrics and learn when to use each one. These insights can change how you manage your equipment. Both metrics matter—but they serve different purposes in different situations.
Understanding the Core Metrics: OEE, OOE, and TEEP
Manufacturing efficiency metrics might look complex at first. Learning about each metric’s unique focus gives a clear picture of how production performs.
OEE: Measuring Scheduled Time Efficiency
Overall Equipment Effectiveness (OEE) works as the foundation to measure production performance. This metric shows how a machine performs only during scheduled production time. OEE combines three vital factors: availability, performance, and quality. Each factor shows different types of production losses.
The formula remains simple: OEE = Availability × Performance × Quality.
Manufacturers starting their improvement experience often see an OEE of 40%, while 60% is what you’d expect in discrete manufacturing. The best performers reach about 85% OEE. These numbers show most operations have room to grow.
OOE: Including Unscheduled Time in Availability
Overall Operations Effectiveness (OOE) builds on OEE by looking at the entire shift time. The measurement works whatever machines were meant to run. Staff meetings and inspections count too, unlike in OEE calculations.
Availability calculations make the big difference. OEE uses planned production time as its base, while OOE looks at total operating time. The formula stays the same: Performance × Quality × Availability. Availability shows the ratio between actual production time and operating time.
OOE paints a clearer picture of how the operation runs. It counts unscheduled periods during shifts. To cite an instance, an eight-hour shift with four hours of active machine time would show 50% OOE availability. This stays true whatever was officially planned.
TEEP: Evaluating All Time Including Idle Periods
Total Effective Equipment Performance (TEEP) takes the measurement further by looking at all potential operating time—24 hours per day, 365 days per year. While OEE and OOE focus on current operations, TEEP reveals the maximum possible capacity.
The formula reads: TEEP = OEE × Utilisation.
TEEP helps answer crucial business questions:
- Should we introduce additional shifts?
- Would running through holidays be beneficial?
- What if we operated through weekends?
TEEP measures availability between total calendar time and actual production time. This makes it valuable to plan capacity and make investment decisions. A factory might run equipment well three days a week but get a low TEEP score. This shows unused capacity.
These three metrics create a system that looks at time from different angles. The view expands from scheduled production (OEE) to total operations (OOE) to maximum theoretical capacity (TEEP).
Breaking Down the Formulas and Time Components
Manufacturing operations reveal significant insights through their efficiency metrics mathematics. Let’s get into each formula to learn how they calculate production performance.
OEE Formula: Performance × Quality × Availability
A single percentage combines three vital factors into Overall Equipment Effectiveness. The standard calculation is OEE = Availability × Performance × Quality. Here’s the breakdown:
- Availability = Run Time / Planned Production Time
- Performance = (Ideal Cycle Time × Total Count) / Run Time
- Quality = Good Count / Total Count
The simplest form of OEE can be expressed as: OEE = (Good Count × Ideal Cycle Time) / Planned Production Time.
TEEP Formula: OEE × Utilisation
Total Effective Equipment Performance builds on OEE by adding utilisation. The formula remains simple: TEEP = OEE × Utilisation. This shows how TEEP expands OEE by looking at all time, not just scheduled production hours.
Availability Definitions Across Metrics
Each metric calculates availability differently based on its time view:
- OEE: Availability = Run Time / Planned Production Time
- OOE: Availability = Actual Production Time / Operating Time
- TEEP: Availability = Actual Production Time / All Time
The main difference lies in what each metric sees as maximum possible time. Run Time equals Planned Production Time minus Stop Time, which includes planned and unplanned stoppages.
Utilisation (%) = (Total Time – Idle Time) / Total Time
Utilisation measures the percentage of calendar time used for production. The calculation reads: Utilisation = Planned Production Time / All Time. Another way to express this: Utilisation (%) = (Total Time – Idle Time) / Total Time.
A factory that runs two eight-hour shifts five days weekly would max out at 48% utilisation, even before counting breaks. This component often shows much untapped capacity in manufacturing operations—some call it the “hidden factory”.
World-class manufacturing facilities typically achieve 80-90% utilisation of total capacity. This indicates most operations can improve their total effective equipment performance substantially.
When to Use OEE vs TEEP in Real-World Scenarios
Manufacturing teams make informed decisions by picking the right performance metric at the right time. Different scenarios and timeframes need specific metrics that serve unique purposes.
OEE for Daily Operational Monitoring
OEE works best as a live operational metric that helps teams understand equipment performance during scheduled production hours. Teams get immediate feedback on current productivity levels, which makes it perfect for daily monitoring and fixing short-term inefficiencies. OEE gives operators and production teams an accurate picture of equipment performance during intended run time by leaving out planned downtime like breaks or scheduled maintenance. The metric answers a simple question: “When we are scheduled to run, are we running well?”. This makes it valuable to spot immediate improvement opportunities within existing production schedules.
TEEP for Long-Term Capacity Planning
TEEP proves its worth as a strategic planning tool for business-level decisions about capacity utilisation. TEEP differs from OEE as it assesses potential production output against a 24/7 operating timeline and reveals untapped capacity in your “hidden factory”. Plant managers use TEEP to learn about critical resource allocation questions: “Should we introduce new shifts? Is it worth running through holidays? What would happen if we ran through weekends?”. It also helps decide if buying additional equipment makes sense or if existing assets could deliver more value. Most operations have substantial room for improvement, as prominent manufacturing plants typically achieve only 80-90% utilisation of total capacity.
OOE for Shift-Level Performance Analysis
OOE connects daily operations with long-term planning by assessing equipment effectiveness across entire shifts, including unscheduled time. The metric looks at both planned and unplanned downtime and offers a broader view than OEE but stays more focused than TEEP. Production managers use OOE to improve shift schedules and spot inefficiencies outside scheduled production periods. OOE gives maintenance teams insights into equipment availability and helps them spot failure trends and enhance preventive maintenance scheduling.
Case Example: Equipment Purchase Decision Based on TEEP
A manufacturer struggled to meet growing demand. The management team thought they needed new equipment. A TEEP analysis showed their current utilisation sat at just 48% (running two eight-hour shifts five days weekly). The team looked at their “hidden factory” by improving OEE factors and extending production into idle periods before investing in new equipment. This approach led to a 30% capacity increase without spending capital. An expert pointed out, “Adding resources first could mean you’re just exacerbating a problem—basically replicating the same poor practises on additional equipment”.
Analysing Total Effective Equipment Performance KPIs
Manufacturing leaders can find valuable insights hidden behind total effective equipment performance numbers. These metrics show opportunities that might stay hidden without deeper analysis.
Hidden Factory Concept in TEEP Analysis
The hidden factory shows unused manufacturing capacity—the extra production you can achieve without spending more money. Armand Feigenbaum created this concept in the late 1970s. He started by looking at quality problems but later expanded it to cover all manufacturing waste. Many operations have 20-40% of their total manufacturing capacity sitting unused.
You can find your hidden factory’s potential with a simple calculation. Take your Fully Productive Time (Good Pieces × Ideal Cycle Time) and subtract it from All Time (24/7). This shows four main types of losses: Schedule Loss (production could run but isn’t planned), Availability Loss (production should run but doesn’t), Performance Loss (production runs slower than needed), and Quality Loss (production makes defects).
TEEP Benchmarks in Manufacturing
Most manufacturers are surprised to find they have more unused capacity than active capacity in their hidden factory. Even world-class manufacturing plants that run non-stop usually use only 80-90% of their total capacity.
TEEP’s biggest strength lies in its detailed tracking—it looks at every minute on the calendar. This stops any excuses about how assets get used. TEEP scores often look low at first, which shows room for improvement.
Limitations of TEEP in Non-Continuous Operations
TEEP has clear drawbacks despite its benefits. Collecting accurate data takes lots of work, especially in big facilities with huge data volumes. Equipment conditions and operational needs change faster too, which means systems need constant updates.
Plants feel pressure to maximise usage without thinking about real limits. Just because a plant can run 24/7 doesn’t mean it should. Running at maximum speed brings new costs through extra labour, more wear and tear, higher energy use, and less time for maintenance.
TEEP doesn’t directly measure maintenance or quality performance because other metrics work better for these areas. Its main value comes from showing where equipment could run but doesn’t.
Your specific manufacturing goals determine which equipment performance metric works best. OEE stands out at tracking daily operations and gives quick feedback when machines should be running. TEEP shows the bigger picture by measuring your equipment against its maximum theoretical capacity.
On top of that, these metrics deliver the best results when used together. OEE helps teams tackle immediate production problems, while TEEP spots strategic chances through the “hidden factory” concept. OOE sits between these metrics and offers a middle-ground point of view that looks at entire shifts.
Manufacturing leaders should see these measurements as tools that work together. The real question isn’t about which metric matters more—both make a big difference but have different purposes. OEE pushes operational excellence during scheduled times, and TEEP guides decisions about capital investment and capacity planning.
Most factories have huge untapped potential, which becomes clear when you understand these metrics. Many operations fall well below the 80-90% capacity utilisation that world-class facilities achieve. This gap gives you a great chance to boost productivity without spending more capital.
Metrics should drive improvement throughout your efficiency experience, not just measure performance. Creating more value with existing resources remains the ultimate goal—both OEE and TEEP help achieve this from different points of view and timeframes.