Production reports form the foundation of streamlined factory operations. Live production reporting plays a crucial role in manufacturing success. Companies that implement reliable reporting systems see their operations with unprecedented clarity and make analytical decisions that boost their bottom line.
Effective production reports must include vital data points such as production process metrics, finished goods count, quality issues, speed, downtime, and various KPIs. Modern live production reporting systems have revolutionised manufacturing tracking methods. The system captures machine data directly from the production source, eliminating the need for manual collection, rationalisation, and human errors.
This piece explores the progress of production data visualisation and reporting from basic manual methods to advanced live systems. You’ll learn about critical metrics used in automated production reporting, specifically Overall Equipment Effectiveness (OEE), Overall Operations Effectiveness (OOE), and Total Effective Equipment Performance (TEEP). The discussion will show you how to convert raw manufacturing data into practical insights that increase efficiency and profitability.
Understanding Production Reporting in Manufacturing
Production reports are the foundation for how manufacturing businesses analyze, visualize, and understand their operational performance, both present and historical. These reports help companies to take the pulse of their factory floor through data collection and analysis from manufacturing processes.
These reports do more than track numbers. They help identify manufacturing process weaknesses, such as bottlenecks, unplanned downtime, and poor machine utilization. Raw data collection isn’t enough – real value comes from turning this data into actionable insights that shape decision-making.
Production reports contain several vital elements. They monitor KPIs related to production rates, quality issues, and downtime. On top of that, they track manufacturing expenses, resource allocation, and management activities to keep operations cost-effective.
The manufacturing sector has moved away from old reporting methods that depended on delayed data and manual analysis. These outdated approaches often had errors that spread through the system as information moved forward. Modern production reporting is highly automated and collects machine data straight from production sources.
Today’s leading manufacturers monitor specific sets of KPIs and use these metrics to review business performance and guide decisions. While traditional metrics like Overall Equipment Effectiveness (OEE) and downtime still matter for measuring manufacturing efficiency, continuous improvement needs more metrics that cover productivity factors.
Performance system data requires quick action. Production managers will find it hard to uncover problem mechanisms without swift responses. Shop floor teams should use this data to spot process inefficiencies. This creates a culture of continuous improvement as operators participate in the system and see its benefits.
Production reporting ended up providing the foundation for manufacturing visibility. This gives businesses the power to access and monitor critical information throughout their manufacturing process and supply chain. It connects demand to production and leads to better decisions.
From Manual Logs to Real-Time Production Reporting Systems
The progress from paper-based systems to digital solutions represents a fundamental change in manufacturing production reports. Factory floors used to depend on manual data collection, and operators recorded information at set times. This approach delayed the recognition of operational challenges and slowed down decision-making.
Manual reporting systems have several critical flaws. Research shows that 71% of manufacturers continue to use spreadsheets or manual processes to track operations. These outdated methods create blind spots in operations because data is recorded after shifts have ended. Quality problems continue unchecked while scrap increases, which results in poor resource allocation.
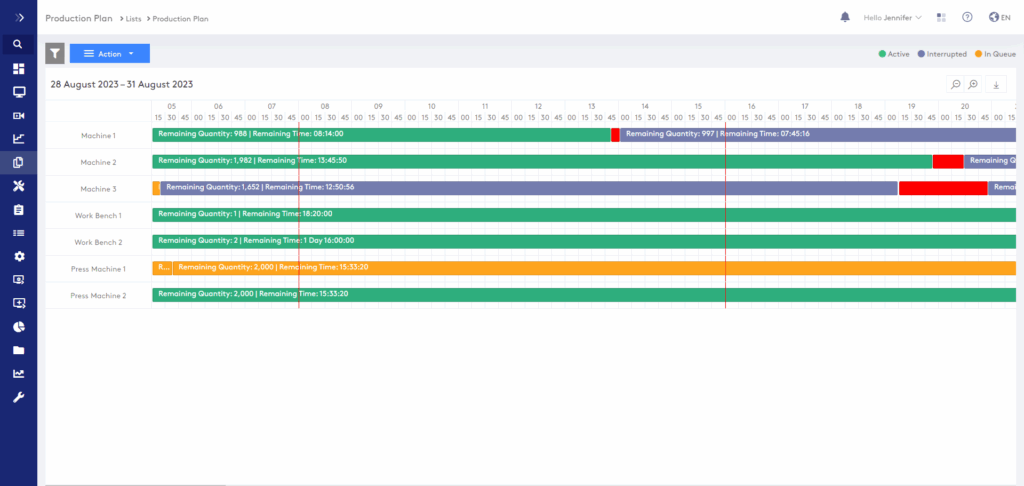
Modern production reporting systems connect directly to machine assets and capture data automatically. Managers can access current reports that show the actual state of manufacturing processes. These systems can detect issues in seconds instead of the previous 15-30 minutes, which improves response times dramatically.
Advanced systems typically include these technological components:
- Data collection layers with direct PLC connectivity
- Edge devices for original processing
- IIoT sensors to update existing equipment
- Machine learning algorithms that optimise continuously
Automated systems offer more than just speed advantages. They eliminate human error and bias, maintain consistent reporting formats, and aid deeper analysis. A food processor reduced its fill weight standard deviation by 27% through immediate monitoring, which saved $215,000 in annual material costs.
Companies across industries have found automated systems economically valuable. Metal fabricators cut downtime by 32%, while other manufacturers increased their hourly production by 10-15% without changing equipment. Contract manufacturers improved their uptime by 15% and efficiency by 20% through informed strategies.
The industry now moves toward predictive and prescriptive analytics. These systems not only report past events but also predict outcomes and suggest specific improvements.
Key Metrics and Visualisation Techniques for Manufacturing Reporting
Manufacturing production reports rely on metrics and visualisation techniques as their lifeblood. Raw data transforms into actionable insights that enable manufacturers to make quick, informed decisions.
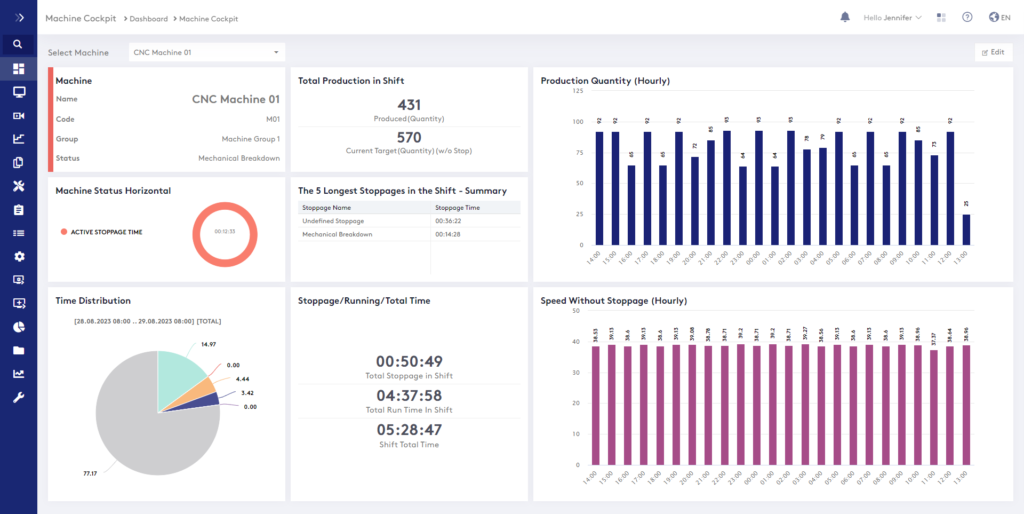
Production performance monitoring happens through manufacturing dashboards. These displays combine machine data, sensors, and operator inputs into easy-to-read breakdowns and provide instant visibility across the shop floor. A well-laid-out dashboard shows critical information right when needed and eliminates manual data gathering.
Equipment utilisation can be measured through three key manufacturing performance metrics:
Overall Equipment Effectiveness (OEE) evaluates production efficiency by measuring availability, performance, and quality during planned production time. The metric shows how efficiently a machine runs when scheduled.
Overall Operations Effectiveness (OOE) goes beyond OEE and looks at total operating time, including unscheduled machine periods. This gives a complete view of operational efficiency.
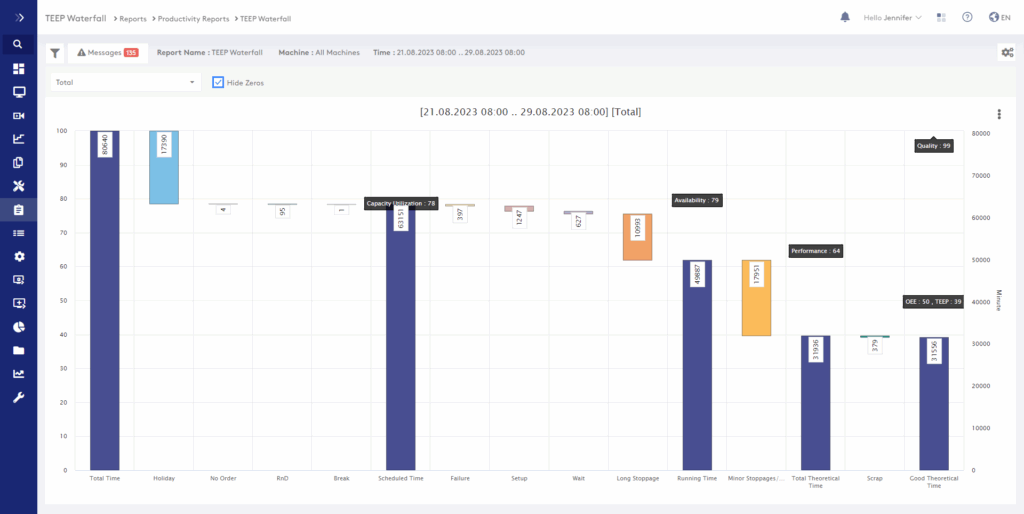
Total Effective Equipment Performance (TEEP) evaluates productivity against all available time (24/7/365) and reveals the true production capacity of operations.
Pareto charts have become vital tools for quality analysis. These charts help teams identify the most critical quality issues, based on the principle that 80% of problems stem from 20% of causes. Manufacturing teams use these visuals to improve areas that deliver the best results.
Scrap rate analytics help manufacturers find quality control problems and operational inefficiencies by tracking unusable units produced. Companies achieve better profitability with normal scrap rates between 2-5% compared to competitors with higher rates.
Machine Operator Efficiency (MOE) metrics evaluate individual performance through availability, output, and quality factors. These metrics help identify training needs and optimise resource allocation.
Manufacturers can spot bottlenecks, predict equipment failures, and improve production flows using heat maps, bar charts, and line graphs. These visualisation techniques turn complex data into clear insights that boost continuous improvement.
Manufacturing production’s coverage has changed dramatically from simple paper logs to sophisticated up-to-the-minute systems. Without doubt, this development has created a radical alteration in factory operations and decision-making processes. Machine data flows directly instead of going through time-consuming manual processes, so detection times have dropped from thirty minutes to just seconds.
OEE, OOE, and TEEP metrics give manufacturers different but complementary points of view on efficiency. These measurements help identify bottlenecks, reduce downtime, and optimise production schedules when implemented correctly. As with visualisation tools like dashboards, Pareto charts, and heat maps, complex data becomes clear and useful information that teams can use right away.
Modern production reporting systems are better than traditional methods. They remove human error through automated data collection. The systems also create consistent reporting formats and allow deeper analysis of manufacturing processes. Companies using these systems have seen big improvements in uptime, efficiency, and reduced material waste.
The path from raw data to up-to-the-minute insights means more than just better technology. It shows a radical change where shop floor teams involve themselves with performance data to improve continuously. Manufacturing continues to evolve, and companies aiming to stay competitive must quickly convert production data into meaningful insights in today’s complex marketplace.